.png)
Dashboard Creation Process
Who can use this Hierarchy?
This process is specifically designed for teams looking to enhance their project tracking and data visualization capabilities in Jira.
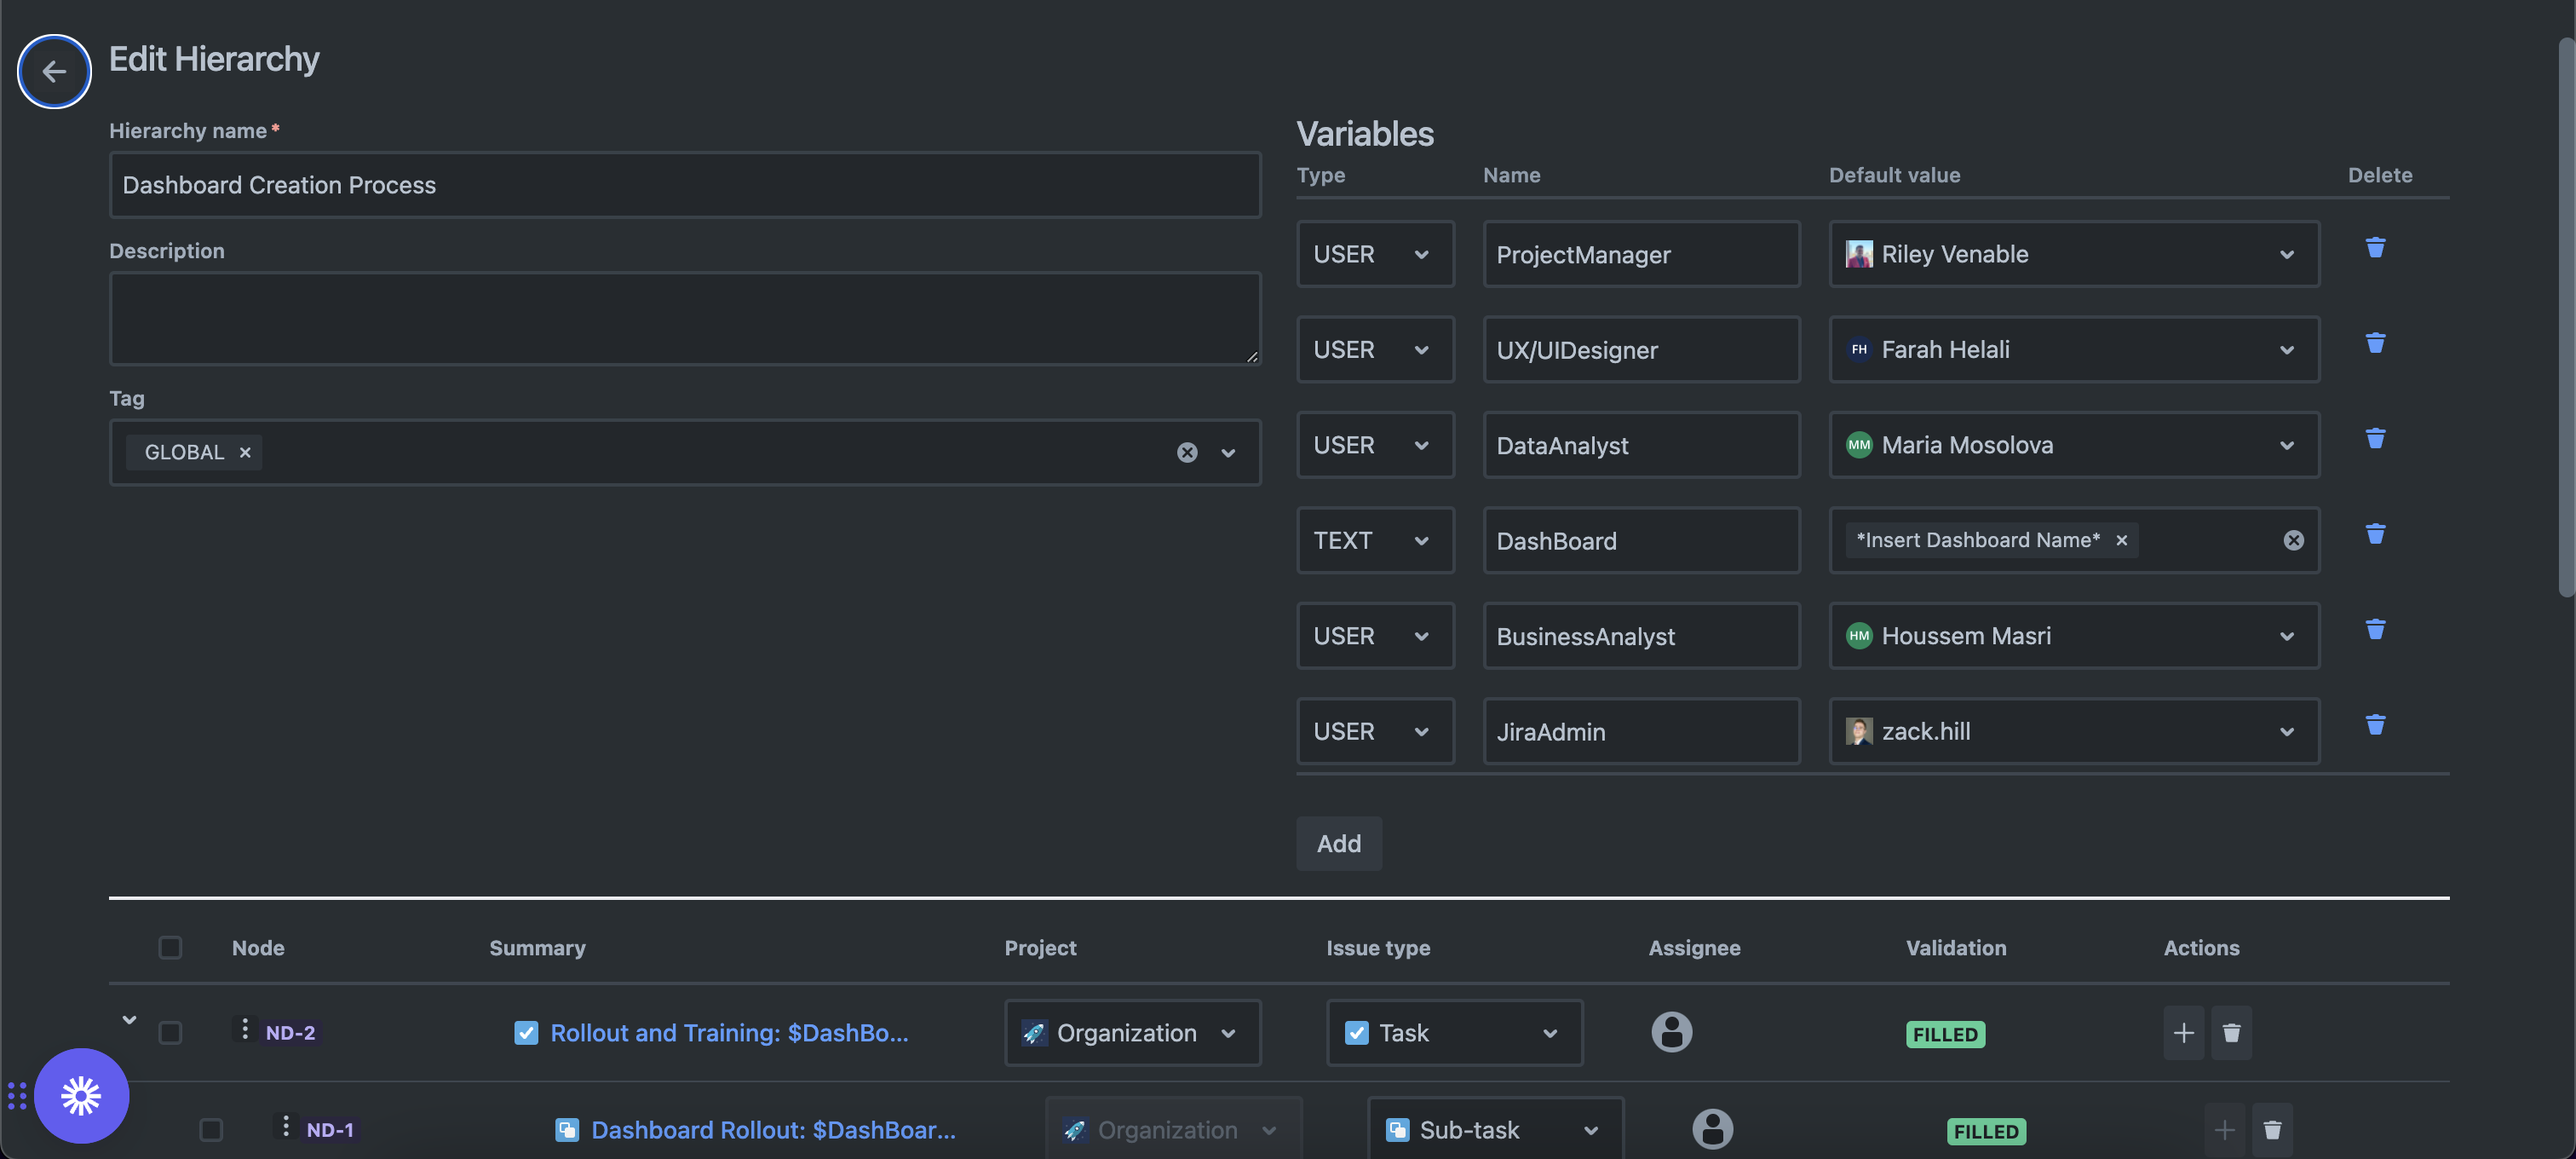
Roles
Project Manager
Business Analyst
UX/UI Designer
Jira Administrators
Departments
Project Management
Business Analysis
IT and Operations
Industries
Any
Demonstration Video
Watch our demonstration video to see a step-by-step guide on how to set up and customize dashboards in Jira, making complex data easily accessible and actionable.
Description of the Hierarchy
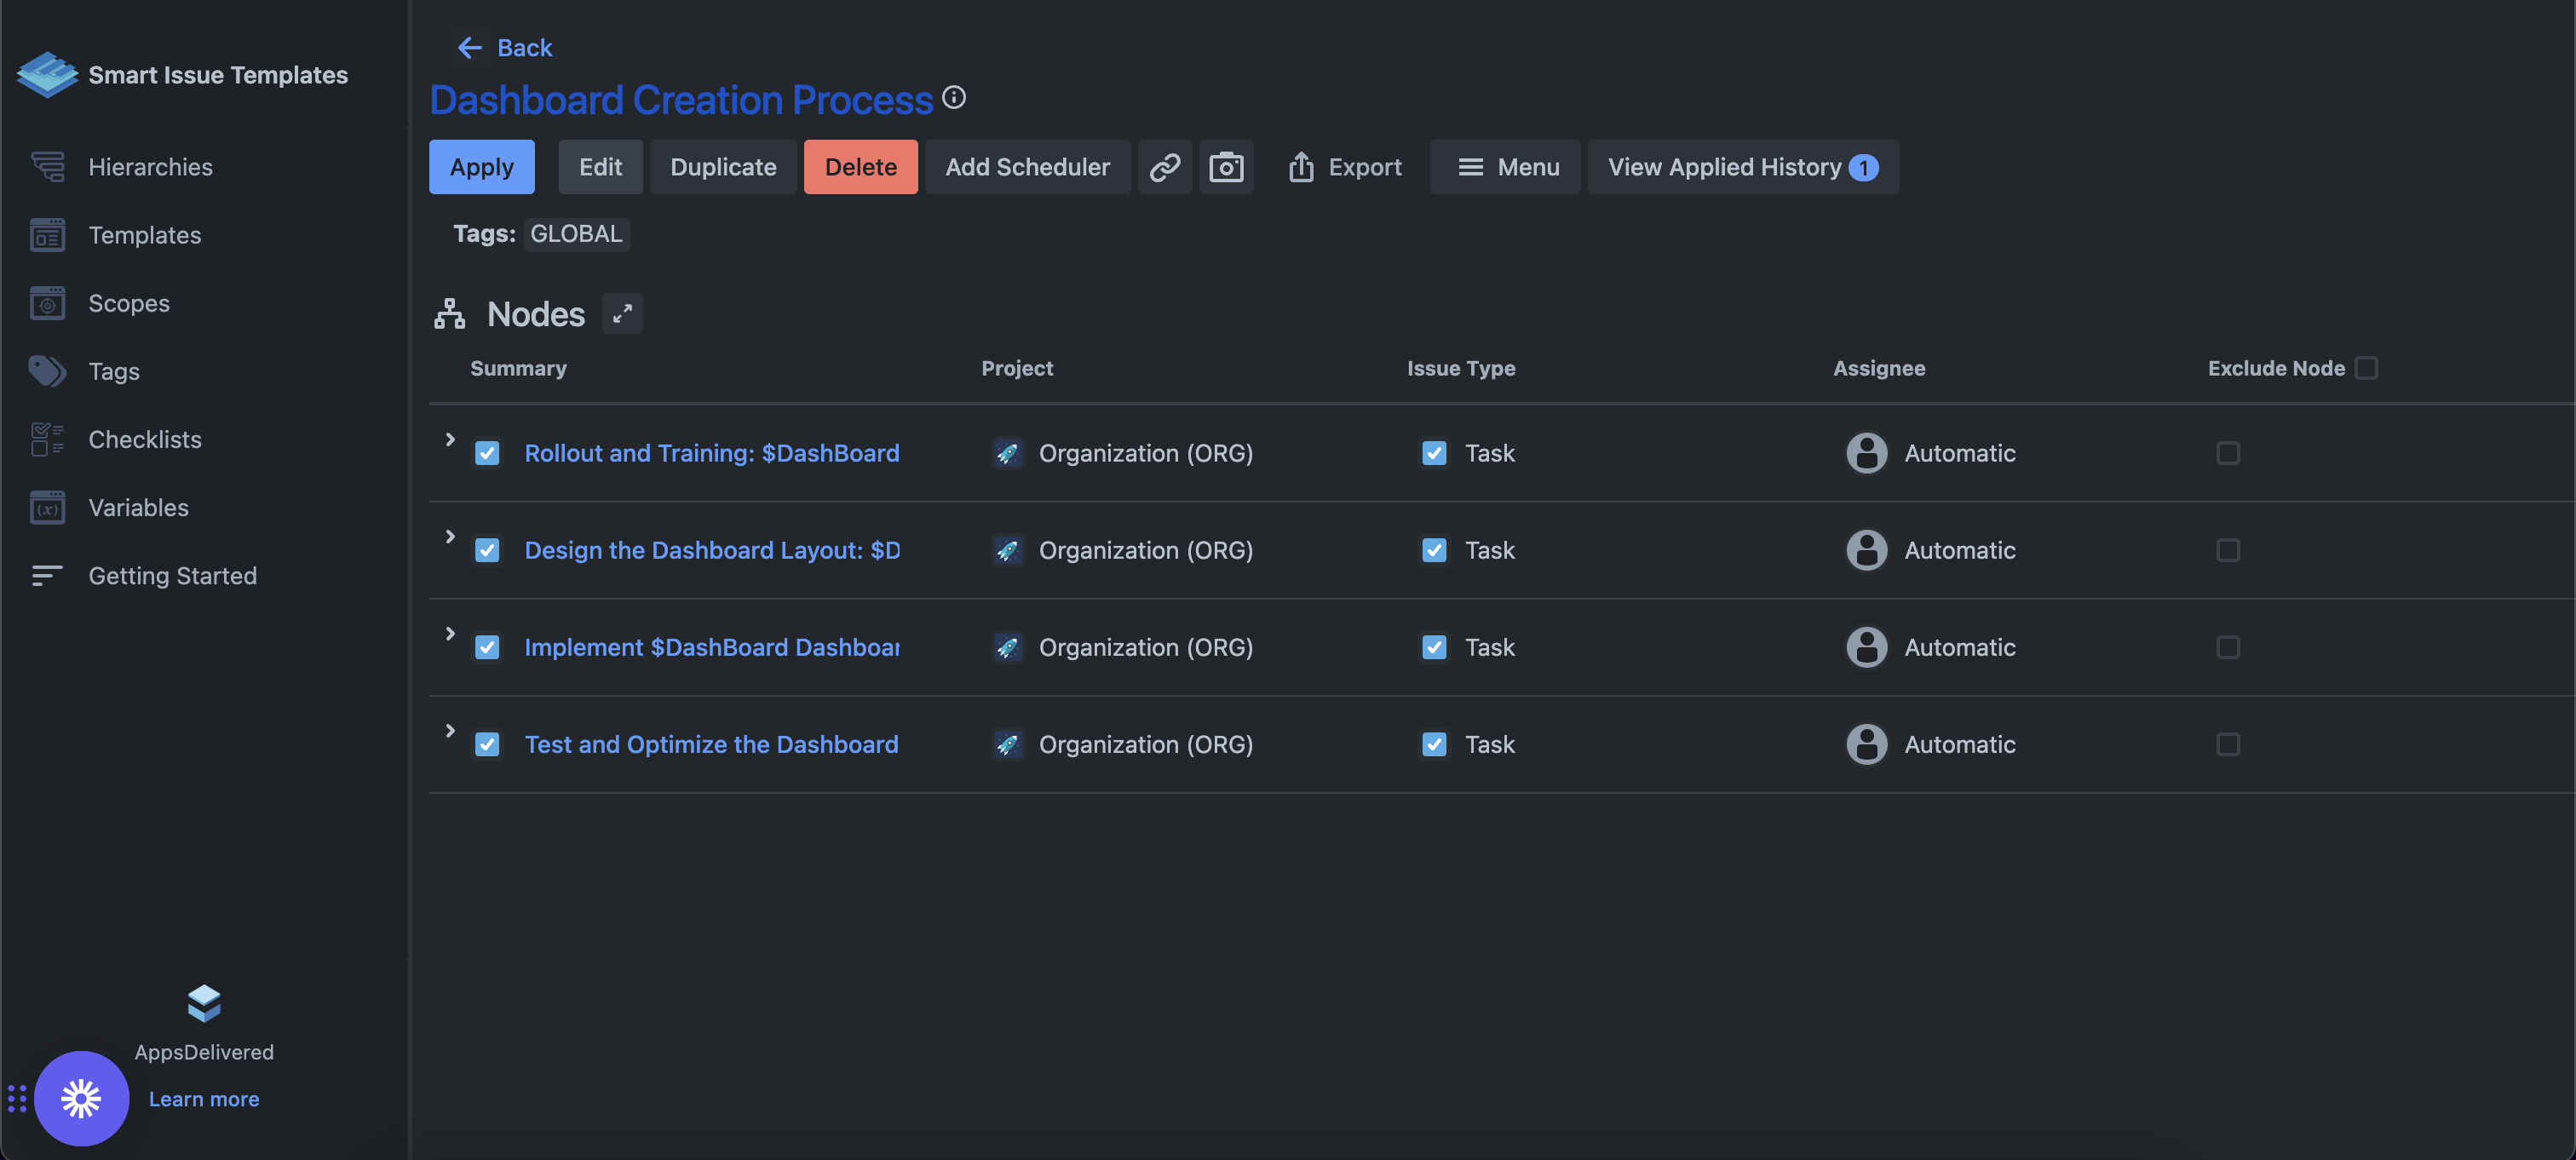
Main Components and Workflow:
Define Dashboard Requirements: Establish what the dashboard needs to accomplish and which metrics it will display to ensure it provides valuable insights.
Design the Dashboard Layout: Create a user-friendly and effective layout that facilitates easy comprehension of the displayed data.
Implement Dashboard in Jira: Use Jira's capabilities to build the dashboard with the appropriate widgets and data sources.
Test and Optimize the Dashboard: Ensure the dashboard operates efficiently and meets user needs through rigorous testing and optimization.
Rollout and Training: Deploy the dashboard to all relevant users and provide necessary training to maximize its utility.Each task is critical for identifying bugs early and often, reducing the likelihood of bugs making it into production releases.
Application Across an Organization:
Implementing this dashboard creation process ensures that all relevant departments have real-time access to important project metrics, facilitating better decision-making and project management. It encourages a data-driven approach to business operations, enhancing overall efficiency and effectiveness.
Outcome and Benefits:
Enhanced Data Visualization: Tailored dashboards that provide critical insights at a glance, improving monitoring and decision-making processes.
Increased Operational Efficiency: Streamlined data access reduces time spent on data compilation and analysis.
Improved Project Tracking: Real-time tracking capabilities enable quicker responses to project dynamics, preventing delays and cost overruns.
User-Centric Design: Dashboards designed with user feedback ensure high usability and satisfaction.
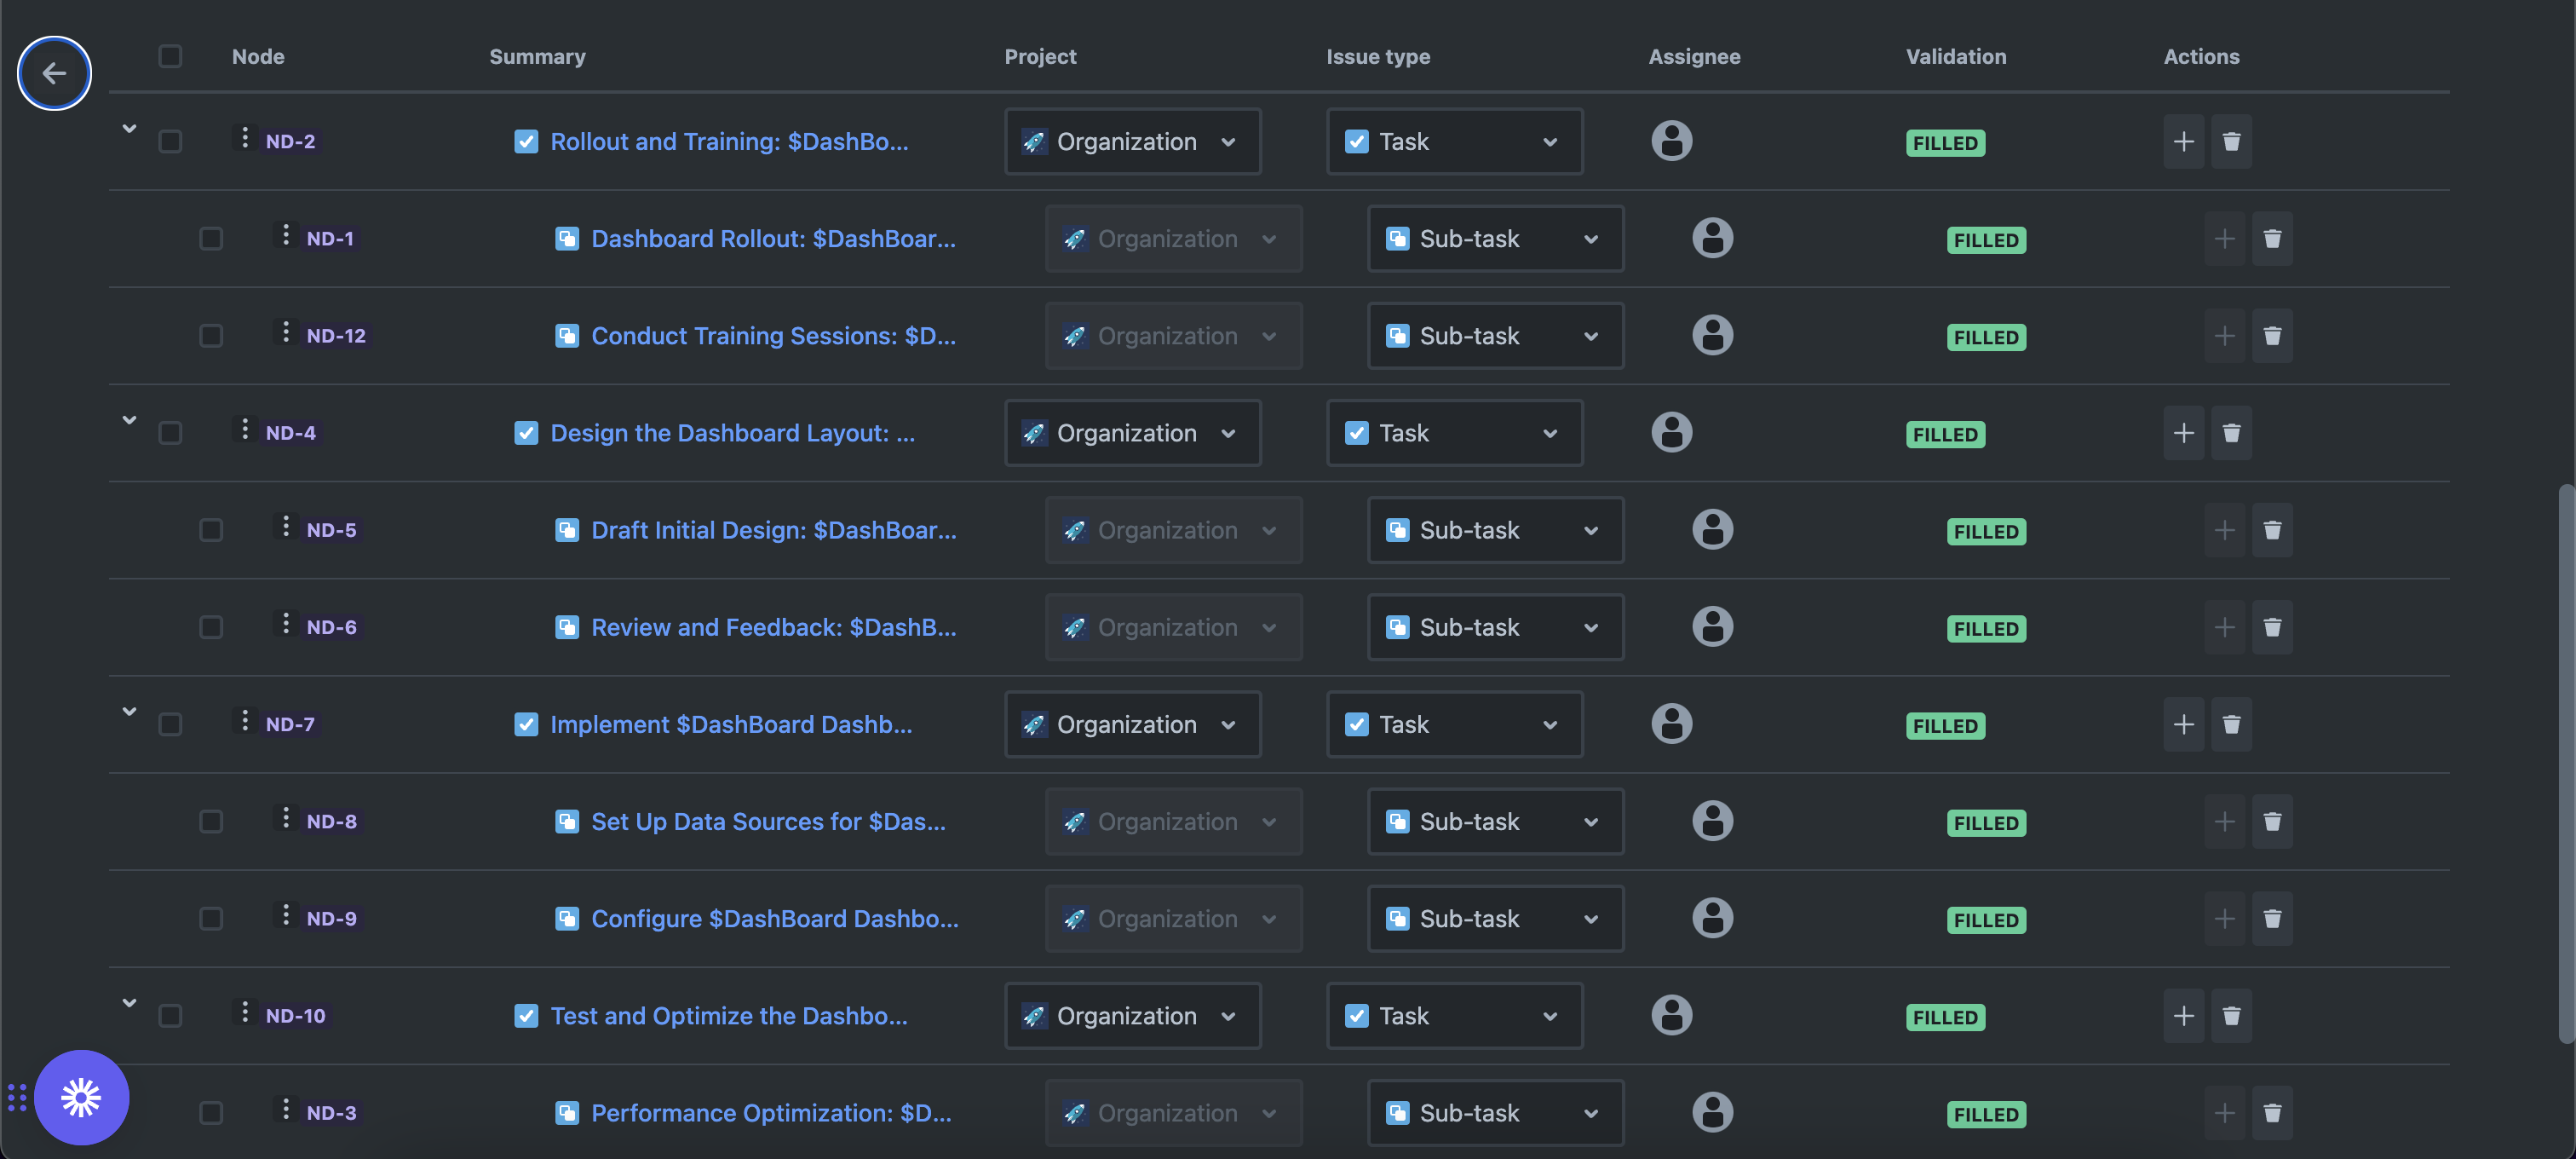
Hierarchy Structure
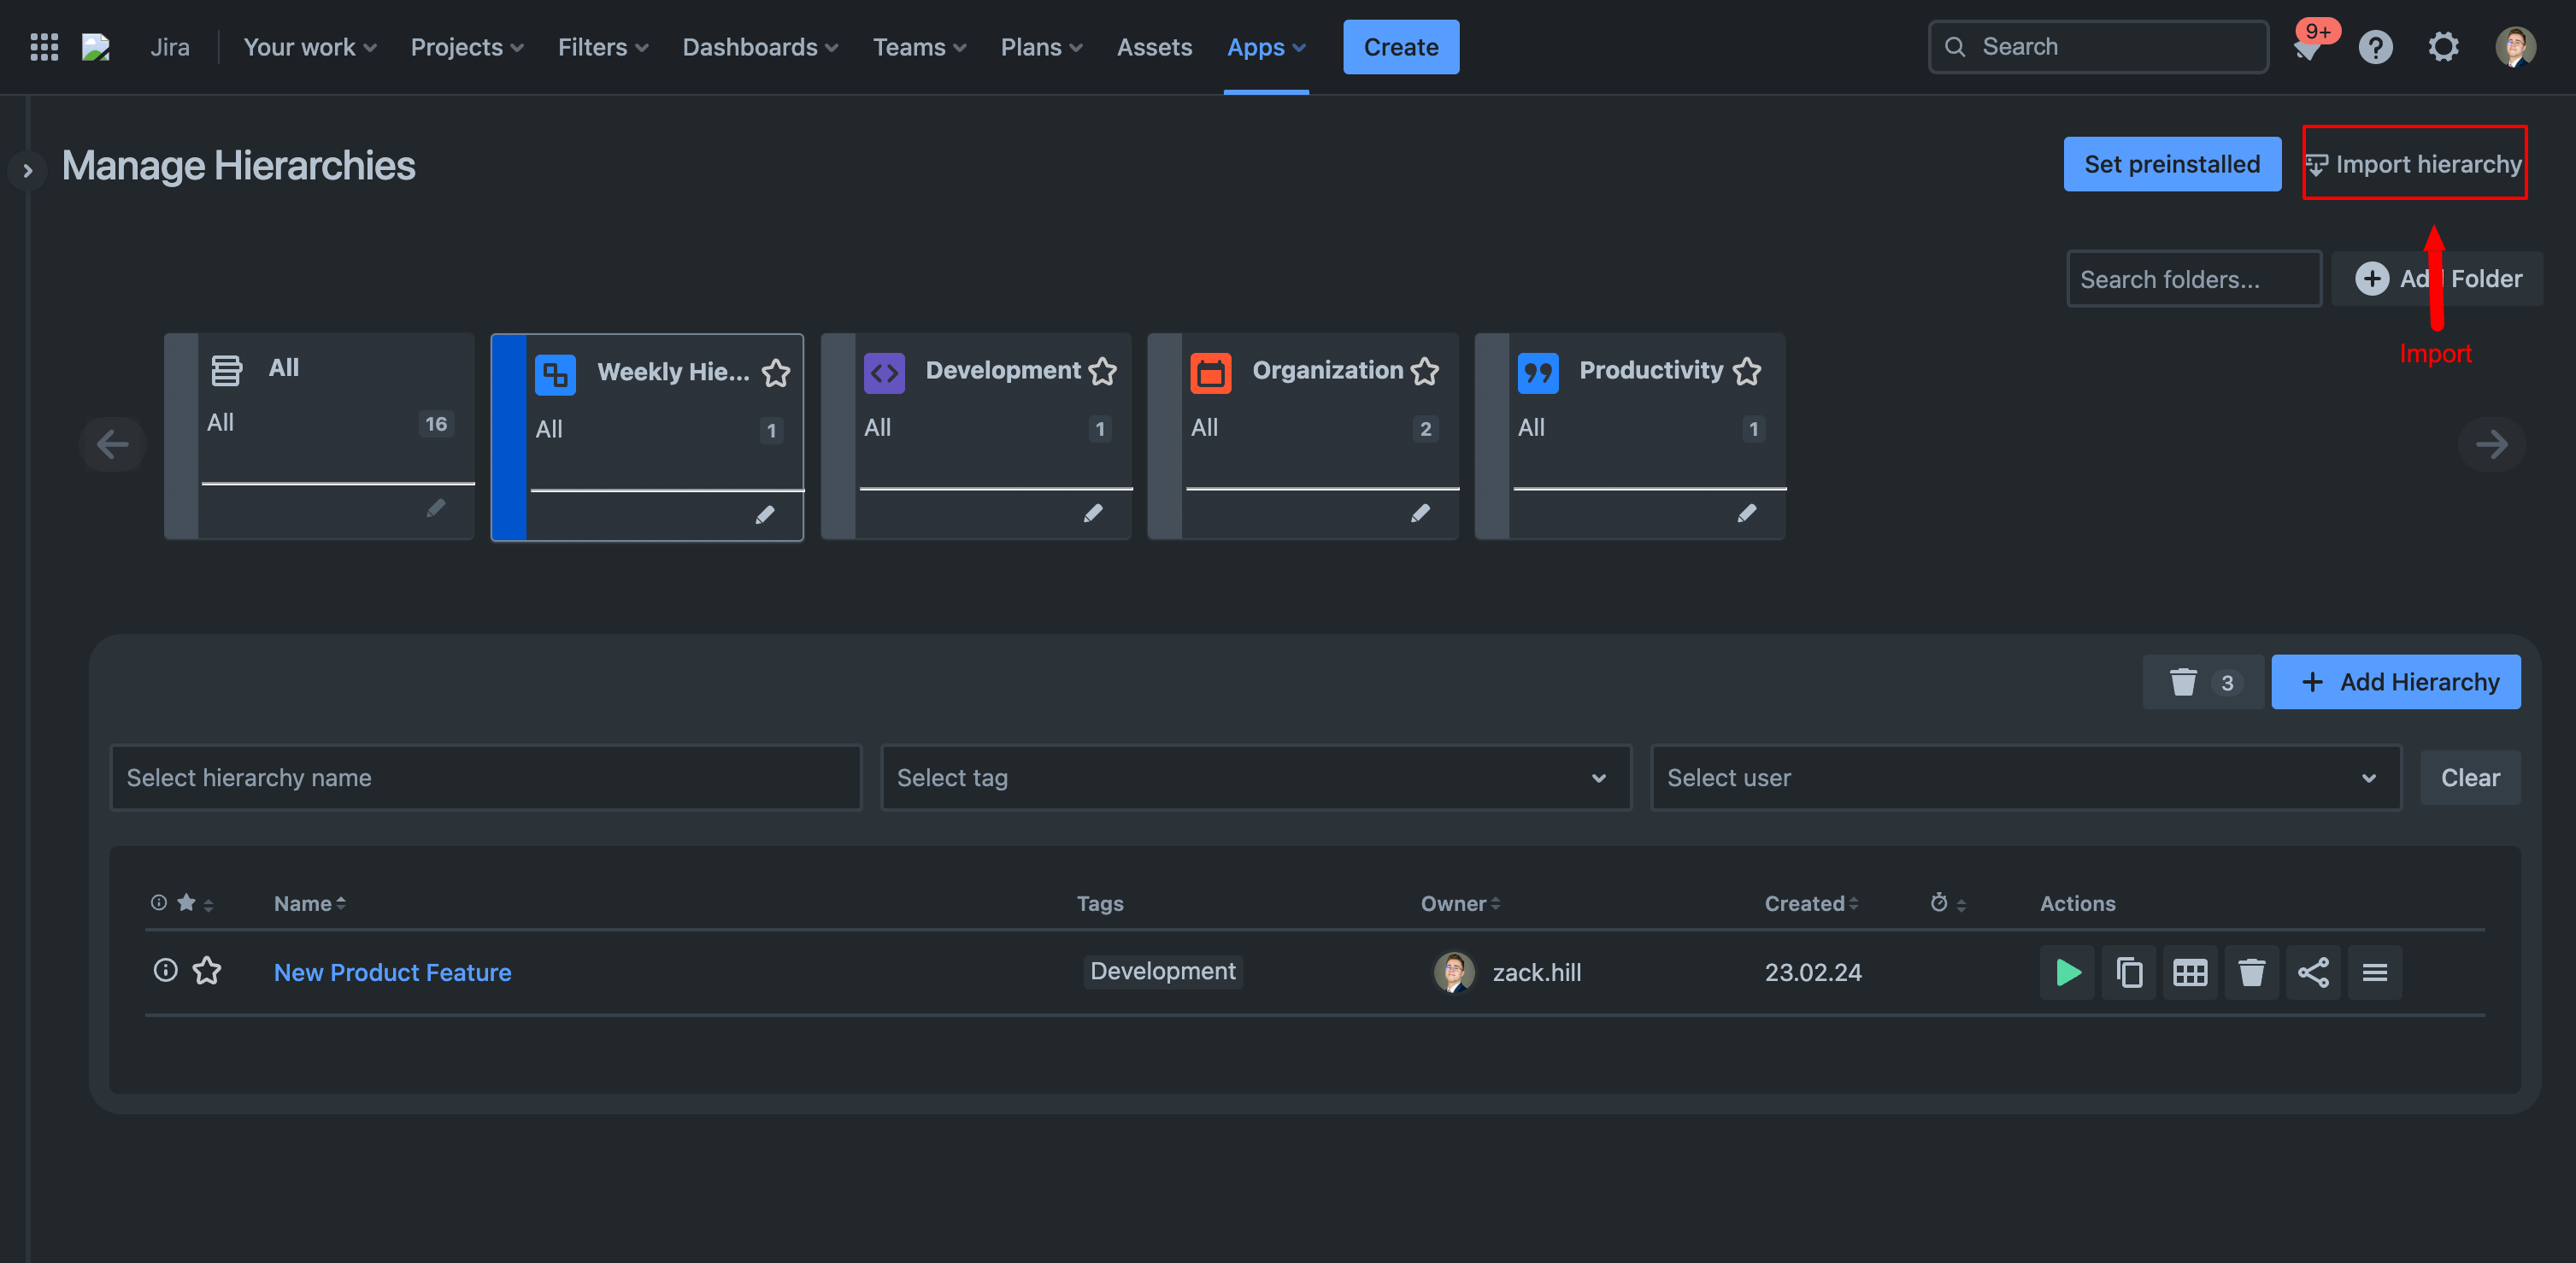
Download and Import the Hierarchy
Download the file below, go the manage hierarchies screen, and click import to use the hierarchy.
Dashboard Creation Process.txt
Example